
Pernambuco in Brazil's 2025 Public Security Yearbook
A series of interactive visualizations on violence, prisons, intelligence spending and vulnerable populations in Pernambuco.
Challenge
Brazil's Public Security Yearbook brings together one of the country's broadest datasets on violence, crime, prisons, public spending and the work of security institutions. That richness also creates a reading barrier: dozens of indicators spread across extensive tables make it difficult to quickly identify how a state is positioned, which phenomena deserve attention and where meaningful differences appear between territories.
The challenge of this project was to use Pernambuco as a starting point for turning different sections of the Yearbook into independent visual stories without reducing public security to a single indicator. The series needed to accommodate very different subjects — from overall lethal violence and the victimization of children and teenagers to deaths in prison, intelligence spending and assaults against LGBTQIAPN+ people — while preserving a consistent visual language and an exploration experience accessible to non-specialist readers.
Solution
I selected, organized and prepared different datasets from the Yearbook and developed a series of interactive Tableau visualizations. Each dashboard starts from a specific question and reorganizes the numbers to support territorial comparison, identification of extremes and pattern recognition rather than simply reproducing the original tables.
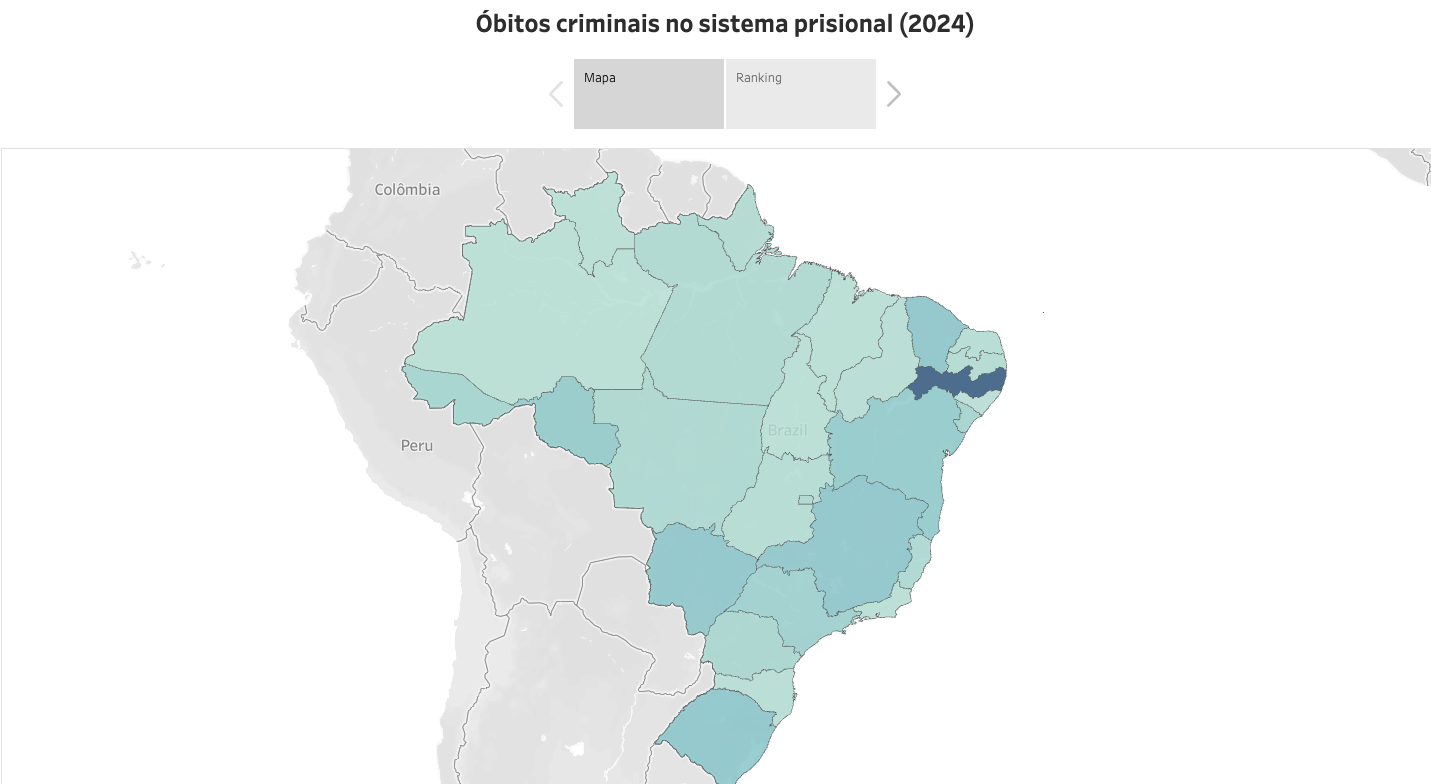
The series includes visualizations on intentional violent deaths in 2024; intentional violent deaths among children and teenagers aged 0–17; intelligence spending; criminal deaths in the prison system; and bodily injuries against LGBTQIAPN+ people. The range of subjects makes it possible to build a broader picture of public security, covering lethal violence, the vulnerability of specific groups, prison conditions and the allocation of public resources.
Impact
The result was a collection of visualizations that adds an editorial and interactive layer to one of Brazil's main public-security data sources. Rather than treating the Yearbook as a single mass of indicators, the project breaks the dataset into specific visual questions and offers multiple entry points for understanding Pernambuco's reality.
Within my portfolio, the series is particularly representative of the public-interest side of my data work. It combines research, editorial selection, dataset organization and information design to turn statistics on socially sensitive issues into tools for comparison and exploration.
My role
I was responsible for selecting the subjects, organizing and preparing the data, and designing and building the interactive Tableau dashboards. For each visualization, I defined the information hierarchy, comparison parameters and navigation experience based on the editorial question that the dataset should help answer.
Visualization elements
Intentional violent deaths
A comparative view of lethal violence recorded in 2024, placing Pernambuco within the Brazilian context.
Children and teenagers
A specific view of intentional violent deaths among victims aged 0 to 17.
Intelligence spending
A visualization dedicated to resources allocated to intelligence activities in public security.
Criminal deaths in prisons
A dashboard focused on deaths caused by violence within the prison system.
Violence against LGBTQIAPN+ people
A visualization of recorded bodily injuries against LGBTQIAPN+ people in 2024.