
Income Tax: Winners and Losers After the NBA Offseason
In the NBA, the announced contract is not always the money players take home. Tax geography also plays.
Challenge
NBA contract discussions usually focus on the headline figures announced by teams and agents. Those numbers, however, hide important differences in taxation across the United States, individual states and Canada, which can significantly change how much a player actually takes home. In a league where contracts routinely reach tens or hundreds of millions of dollars, even seemingly small percentage differences can produce enormous financial consequences.
The challenge of the article was to translate that tax system into an accessible sports narrative, connecting a relatively technical economic subject to concrete decisions from the 2024 offseason. The piece needed to explain tax differences without losing journalistic pace and show, case by case, how they could benefit or disadvantage players who changed teams or signed new deals.
Solution
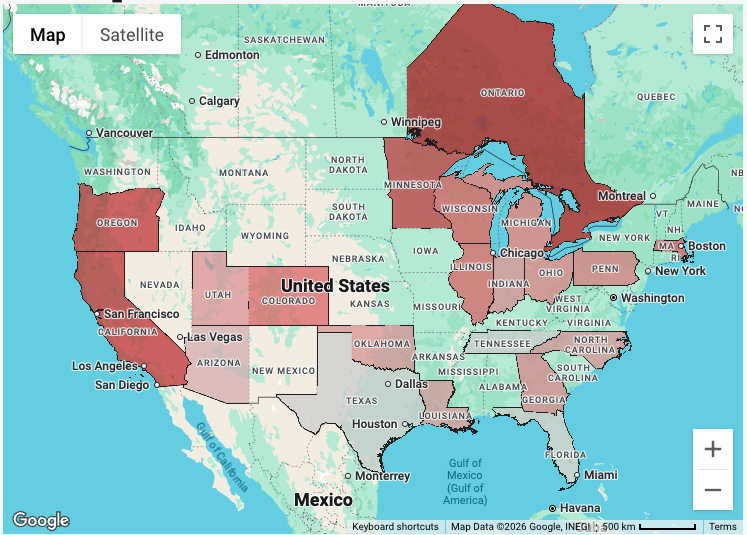
I structured the piece in two stages. First, I presented a fiscal map of the NBA, comparing total income-tax burdens across the markets of all 30 franchises and highlighting the difference between high-tax jurisdictions and states such as Texas, Florida and Tennessee, where there is no state income tax. The rates were compiled from sources including SmartAsset and the Tax Foundation.
I then applied that context to specific offseason cases. The article compares headline contract values with estimated after-tax earnings in decisions involving Klay Thompson, Harrison Barnes, Isaiah Hartenstein, Paul George, Caleb Martin, Derrick Jones Jr., Joe Ingles and Tim Hardaway Jr. The “winners” and “losers” structure turns the tax issue into a concrete and comparable narrative, showing how franchise location can change the real economic value of a basketball decision.
Impact
The result is an analytical feature connecting basketball, economics and fiscal geography to provide an unusual perspective on the NBA offseason. Rather than treating contracts only by their gross value, the story shows how the same amount of money can produce very different financial outcomes depending on the market where a player works.
Within my portfolio, the article is relevant because it demonstrates the ability to research a technical subject outside traditional sports coverage and turn it into accessible, comparative and data-informed journalism. It also reinforces my NBA expertise and my ability to connect sport with broader economic, legal and geographic issues.
My role
I researched, reported and wrote the article, bringing together tax data, fiscal rules, contract values and information about offseason negotiations. I also built the comparisons between gross contract figures and estimated after-tax earnings used throughout the story.
Reporting angles
NBA tax map
A comparison of total income-tax burdens across NBA franchise markets.
After-tax contracts
Headline contract values are compared with estimated take-home earnings to show the real impact of franchise location.
Eight case studies
Klay Thompson, Harrison Barnes, Isaiah Hartenstein, Paul George, Caleb Martin, Derrick Jones Jr., Joe Ingles and Tim Hardaway Jr. make the analysis concrete.
Sport + economics
The article uses the NBA offseason as an entry point for explaining tax differences across states and countries.